
Page 23 - Annual Report 2018/19
P. 23
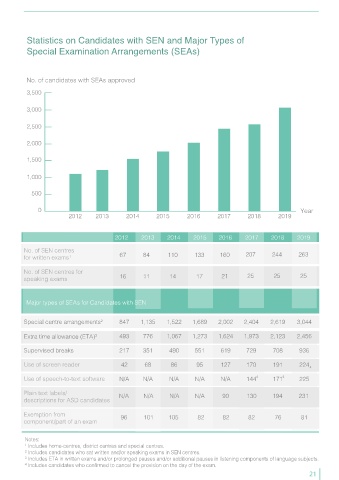
Statistics on Candidates with SEN and Major Types of
          Special Examination Arrangements (SEAs)


          No. of candidates with SEAs approved

          3,500


          3,000

          2,500


          2,000

          1,500


          1,000


            500


              0                                                                                            Year
                         2012      2013      2014       2015       2016      2017       2018       2019


                                         2012      2013     2014     2015     2016     2017     2018     2019
         No. of SEN centres
         for written exams¹                67      84       110      133      160      207       244      263

         No. of SEN centres for
         speaking exams                    16      11        14       17       21       25       25       25


          Major types of SEAs for Candidates with SEN


         Special centre arrangements²      847    1,135     1,522    1,689    2,002    2,404    2,619    3,044

         Extra time allowance (ETA)³       493     776      1,067    1,273    1,624    1,973    2,123    2,456

         Supervised breaks                 217     351      490      551       619      729      708      936

         Use of screen reader               42      68       86       95       127      170      191      224
                                                                                                              4
         Use of speech-to-text software    N/A     N/A      N/A      N/A       N/A      144 4    171 4    225


         Plain text labels/                N/A     N/A       N/A     N/A       90       130      194      231
         descriptions for ASD candidates

         Exemption from                    96      101      105       82       82       82        76       81
         component/part of an exam


          Notes:
          ¹ Includes home-centres, district centres and special centres.
          ² Includes candidates who sat written and/or speaking exams in SEN centres.
          ³ Includes ETA in written exams and/or prolonged pauses and/or additional pauses in listening components of language subjects.
          4   Includes candidates who confirmed to cancel the provision on the day of the exam.
                                                                                                              21